Featured image: Edited cover illustration to the “Complete Version of ye Three Blind Mice” from the Library of Congress. From Stuart Rankin on Flickr
A debate is taking place within some educational research circles about the ethics of algorithms and, in particular, learning analytics. Spurred by a heightened awareness of social justice issues after the recent racial unrest in the US , the debate recently turned to the topic of colour-blind analytics designed to artificially exclude demographic measures (overwhelmingly associated with educational success) from predictive models. New and relevant research on the matter has also been published in the journal Big Data and Society (Whitman, 2020). In her article, Madisson Whitman describes the practical and contingent ways in which administrators and data scientists in an American university engineered a distinction between types of student data: attributes and behaviours. While the former were represented as fixed and immutable characteristics, race being the perfect example, the latter were meant to reflect actions and choices students could actually make and have control over. The decision to exclude attributes from the recommender and personalisation systems, thus rendering them “colour blind”, was therefore construed by the university personnel as ethically driven, while the focus on behavioural proxies underscored a firm belief that students are ultimately rational decision makers, responsible for their own outcomes.
by treating demographic data as attributes that are frozen—everything a student “can’t change”—personnel remove those data from an ongoing conversation about what they can use in the model.
The article ends by questioning the logic that underpins the artificial (“data are made” claims Whitman) separation between attributes and behaviours: “what happens when behaviour data are just as fraught as demographic data?” Asks Whitman, pointing to the underdetermined nature of behavioural proxies, i.e. the fact that they are not naturally occurring but are the result of a web of local and structural factors , which have direct and indirect influences that contradict the “rational choice” postulate of learning analytics. What if, even under the right instructional circumstances and with an appropriately constructed “nudge”, an individual will not choose the option more likely to maximise personal gain?
The article prompted a measured response from Simon Buckingham-Shum, a highly cited researcher from the learning analytics community. His response sets off from a deliberately blunt dichotomy between two camps: a “yes” camp that wants algorithmic models to ignore unjust demographic factors to avoid pernicious labelling dynamics; and a “no” camp that staunchly defends the need to include all relevant attributes, because they can improve predictive performance, while their toxic labelling effects can be cancelled through considerate design.
Buckingham-Shum acknowledges the need for further discussion, and raises some very interesting questions, such as “does anyone contest the positive outcomes for students from the use of predictive models?” He unsurprisingly brings up Georgia State University, an institution that succeeded in using algorithmic personalisation to boost graduation rates among a predominantly black and underprivileged student population. How can anyone doubt the evidence? Surely, it is a good thing if more students from ethnic minorities complete their degrees.
This is a very good point. In this post, I intend to scrutinise it but not entirely on the terms implicitly set by Buckingham-Shum. I am a social scientist, and although I have written a couple of papers about learning analytics, I will not enter here into a discussion about the methodological robustness of predictive models, nor I intend to question to veracity of the claims made on their behalf. As for the broader issue of “blindness” in the technology industry and algorithm design, it is essential to acknowledge the work of several scholars operating at the crossroads of race, gender, social justice and Science and Technology Studies (Crooks, 2017; Daniels, 2015), as well as important attempts to develop critical race methodologies in algorithmic fairness (Hanna, Denton, Smart, & Smith-Loud, 2020).
So, instead of addressing directly the issue of race I will draw on broader, public evidence about Georgia State’s place as a haven of social mobility in the turbulent and heavily stratified US higher education sector. This might sound anticlimactic and out of touch. The current trend is to keep the debate about algorithmic accountability within the boundaries of a sociotechnical examination, halfway between computer science and ethnography – an approach which seems at times overly preoccupied with the “socially-inflected technical” (the algorithmic black boxes, the inductive fallacies, the biased datasets, the data materialisations) at the expense of the purely social and political. I am perhaps guilty of the same (Perrotta & Selwyn, 2019) but here, for once, I want to do precisely the opposite.
Georgia State University’s success: what does it tell us (indirectly) about the role of algorithms in social mobility?
Georgia State University is, according to all official measures, one of the top performing institutions for advancing social mobility in the US. Their “moneyball” approach made the headlines in recent years for…
Monitoring 800 risk factors almost in real time – achieving big dividends for the university whose student body is 60 percent low income and 60 percent minority, with a big increase in STEM degrees for good measure.
GSU is highly placed (51th) in the rankings developed using the Social Mobility Index, a sophisticated measure computed from five variables: published tuition, percent of student body whose families’ incomes are below $48K (slightly below the US median), graduation rate, median salary approximately 5 years after graduation, and endowment.
In 2011, Georgia State’s graduation rate for its historically black student population was 48%. In 2018, after the introduction of their predictive modelling approach, it went up to 55%. This is a considerable improvement, but perhaps not as transformative as some in the learning analytics community would like to believe. By all accounts, however, GSU is succeeding in eliminating achievement gaps based on income and ethnicity.
Of course, data stories become suddenly more complex when placed in a wider context. The US is one of the most unequal countries in the world. Evidence (incidentally, available on the Social Mobility Index website) shows that it is the least economically mobile among all developed nations.
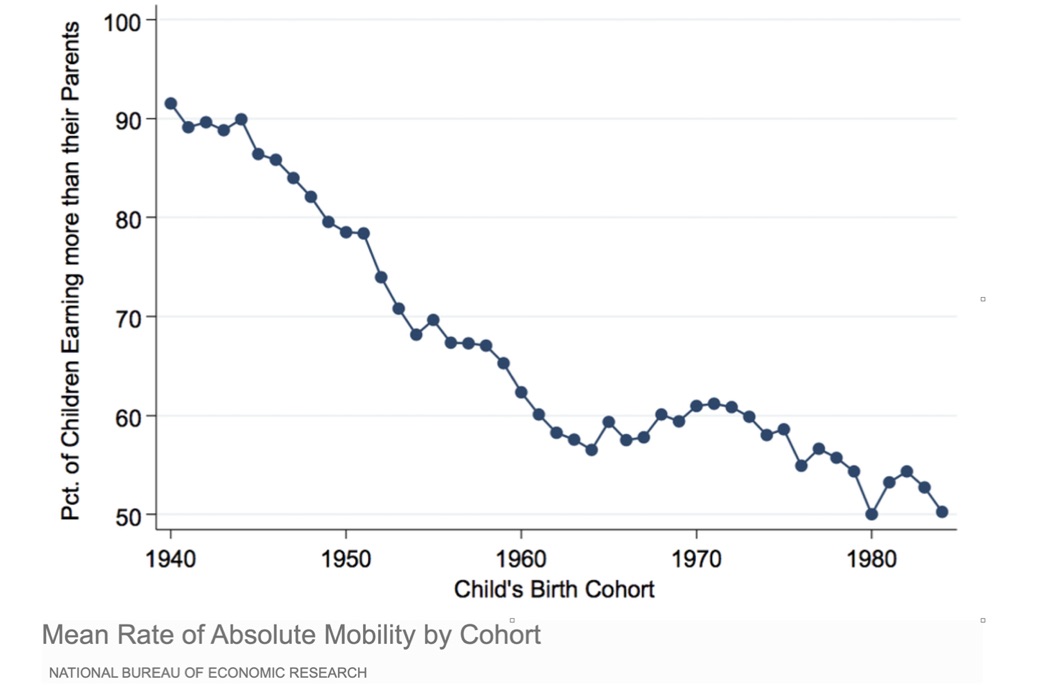
Moreover, official statistics from the American Census Bureau show that since 2000, wages have been stagnant, and large gaps by race and gender endure despite an expanding economy.
Such appalling levels of inequality extend obviously to the education sector as well, and while the work carried out at Georgia State is commendable and its positive impact on the lives of black graduates is beyond doubt, the fact remains that GSU is part of one of the most stratified higher education systems in the world. Quantitative research from 2012 (Davies & Zarifa, 2012) painted a stark picture of fierce competition around institutional status, reputation and pretty much every aspect of performance including outcomes of graduates. Here are a couple of excerpts from this still very relevant study.
Notions of “Matthew effects” in higher education (Trow, 1984) suggest that stiffer competition will bolster disparities. The Matthew effect occurs through a process of cumulative advantage in which a favourable position becomes a resource that produces momentum for further gains.
(…)
American higher education has long been marked by its sheer size, diversity, and steep hierarchy (Trow, 1991). Unlike many national systems, it has little central governance (i.e., no federal body that oversees higher education) a large private sector, and an extensive array of differentiated forms, ranging from research-intensive institutions, to religious colleges, to liberal arts colleges, to historically Black colleges, to large state colleges. The U.S. public sector has clearly designated flagship state universities. This unequal state funding makes the American public sector more similar to England’s Oxbridge and France’s Grandes Ecoles.
Universities in the US, like in many other countries, are deeply divided in terms of status, resources, reputation and ethnicity. Indeed, the evidence about stratification shows beyond doubt that the inequalities between institutions are shaped by political and economic factors, such as austerity measures, that overwhelmingly damage institutions serving underprivileged populations. The consequence, and the main point I wish to make, is that the performance of any individual institution (e.g. GSU) must be seen against a broader background in order to be properly understood, and even outcomes which are by all accounts positive at the institutional level may have problematic ramifications.
I will try to clarify this point by engaging with another thought-provoking question asked by Buckingham-Shum in his post: is any real harm is caused by colour-blind modelling? He acknowledges that marginalised students may not have the same capacity as their privileged peers to respond to algorithmic nudges, but calls for more empirical evidence about how those students actually experience automated nudging, and how their choices change (or not) in response to them.
More evidence would of course be welcome, as long as it takes into account the broader context in which all of this happens (see above).
In their research on higher education in South Africa, a country with a tradition of historically black institutions and an enduring challenge to increase “throughput” (graduation rates), Bozalek and Boughley (Bozalek & Boughey, 2012) drew on the work of the feminist scholar Nancy Fraser on social justice. They suggested that a narrow focus on the success of individual institutions against a background of widespread inequality “misframes” the struggle for social justice of the South African black community.
Academically excluded students in an institution petition their justice claims against their own institution, as the frame is generally seen to be the individual higher education institution itself. From this frame or perspective, the students can have no such claims against the education system as a whole.
Therefore, when exploring the experiences of marginalised groups with colour-blind predictive models, we should be careful not to perpetuate similar misframings. We should consider not only the individual positions and trajectories, but how political and ideological views may be impacted as well. In the case of GSU, how do students who successfully experienced automated nudging see the struggles of other students who did not benefit from it? Have their views about personal agency changed? Have their political views changed? Have their views about their place in the broader, deeply unjust conditions of US education and society changed?
So, is any harm done by colour-blind models? Well, the answer is probably no if by harm we refer to “bad outcomes” for individuals, but yes if we begin to examine how models align with certain politics and not others. How they indirectly or unwittingly advocate a certain view of the world at the expense of alternatives.
Let’s return one last time to the GSU case study and consider for a moment the underlying political narrative of their colour-blind approach to reducing attrition. There are surely many inspiring stories of individual achievement that should not be dismissed, but also (maybe) a validation of a particular, very ideological notion of personal agency that is inherently opposed the development of a collective conscience based on solidarity.
Finally, a cognate, more general point can be made about the goals of learning analytics in higher education. They too do not exist in a vacuum, but reflect pre-existing positional dynamics at the institutional level and the societal level.
I work at Monash University in Australia, one of the main urban institutions in the country and a member of the prestigious Group of 8. While attrition is still a concern for some small student cohorts, the focus of learning analytics at Monash is firmly on improving the quality of delivery and thus maximise the positive experience for the (mostly homogeneous) student population, with global rankings clearly in mind.
The logics of predictive modelling at Monash differ in significant ways from those at Georgia State, and both are different from those operating at the British Open University with its distinctive history of distance education. All of this is to say that while it is important to have sociotechnical examinations of colour-blind modelling, it is equally urgent to reflect on why conversations about colour-blind modelling are meaningful only for specific institutions. In this sense, we need to pay more attention to how the academic and commercial work of learning analytics is also unequally stratified, and thus reflects and reproduces systemic patterns of social injustice. Indeed, it could even be argued that colour-blind analytics does little to acknowledge and address the structural inequalities in higher education, and that having colour-blind analytics is an effective way to conceal the structural problems of race that remain inherent in the contexts in which models are deployed. So, perhaps, it is worth entertaining the possibility of not having predictive modelling at all – even when it tries to be “socially just”, because justice only for some, without proper collective engagement and change, means justice for none in the larger scheme of things.
References
Bozalek, V., & Boughey, C. (2012). (Mis)framing Higher Education in South Africa. Social Policy & Administration, 46(6), 688-703. doi:10.1111/j.1467-9515.2012.00863.x
Crooks, R. (2017). Representationalism at work: dashboards and data analytics in urban education. Educational Media International, 54(4), 289-303. doi:10.1080/09523987.2017.1408267
Daniels, J. (2015). “My Brain Database Doesn’t See Skin Color”: Color-Blind Racism in the Technology Industry and in Theorizing the Web. American Behavioral Scientist, 59(11), 1377-1393. doi:10.1177/0002764215578728
Davies, S., & Zarifa, D. (2012). The stratification of universities: Structural inequality in Canada and the United States. Research in Social Stratification and Mobility, 30(2), 143-158. doi:https://doi.org/10.1016/j.rssm.2011.05.003
Hanna, A., Denton, E., Smart, A., & Smith-Loud, J. (2020). Towards a critical race methodology in algorithmic fairness. Paper presented at the Proceedings of the 2020 Conference on Fairness, Accountability, and Transparency, Barcelona, Spain. https://doi.org/10.1145/3351095.3372826
Perrotta, C., & Selwyn, N. (2019). Deep learning goes to school: toward a relational understanding of AI in education. Learning, Media and Technology. doi:10.1080/17439884.2020.1686017
Whitman, M. (2020). “We called that a behavior”: The making of institutional data. Big Data & Society, 7(1), 2053951720932200. doi:10.1177/2053951720932200
